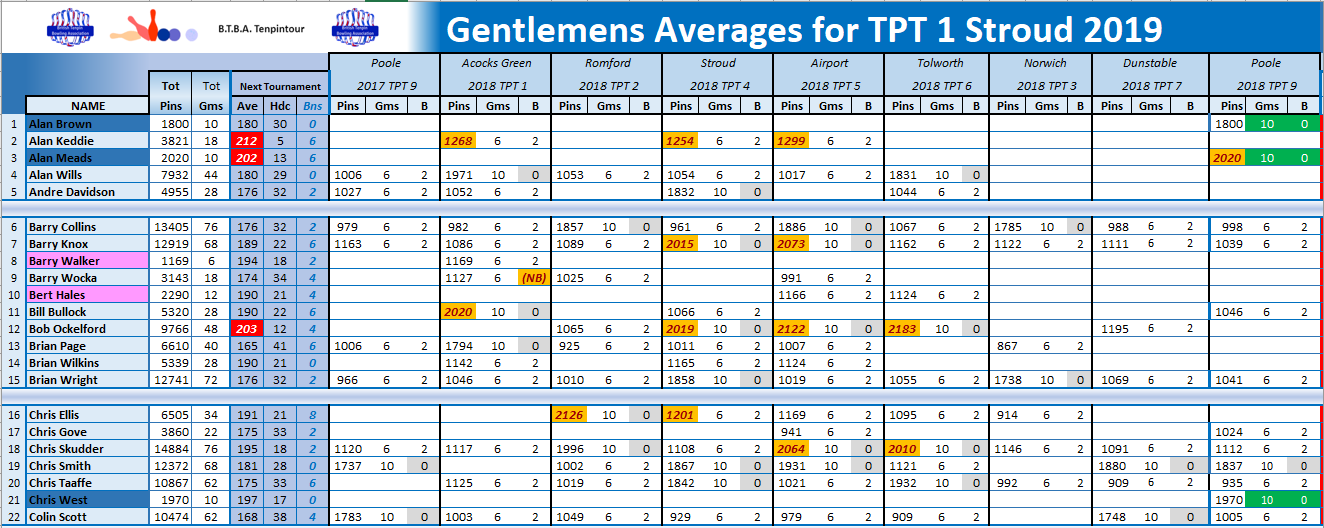
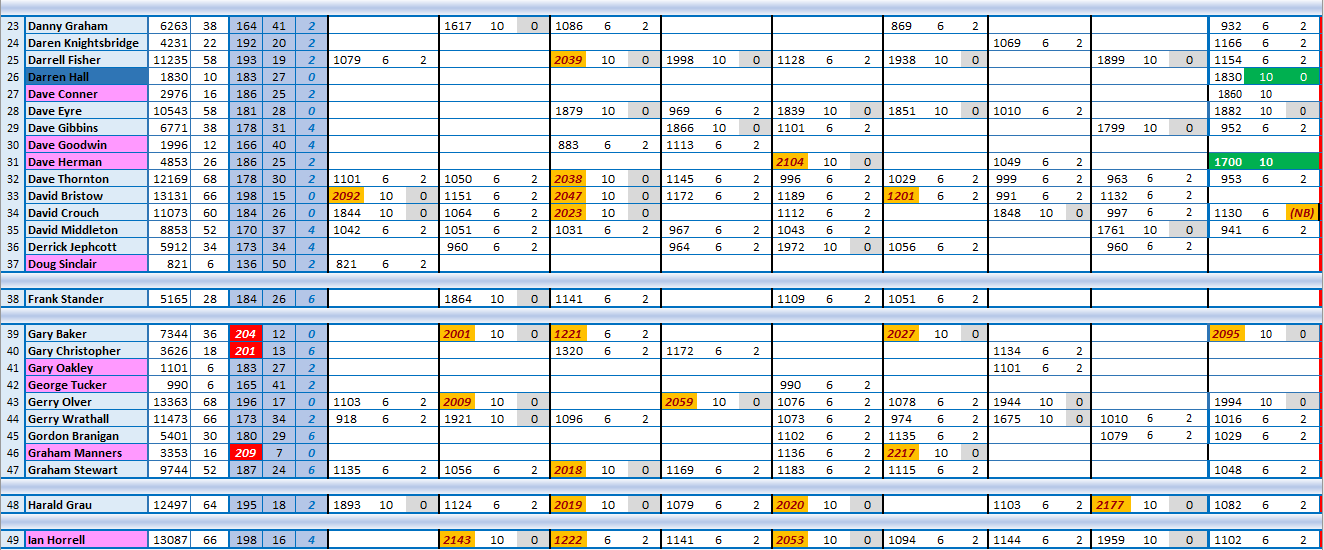
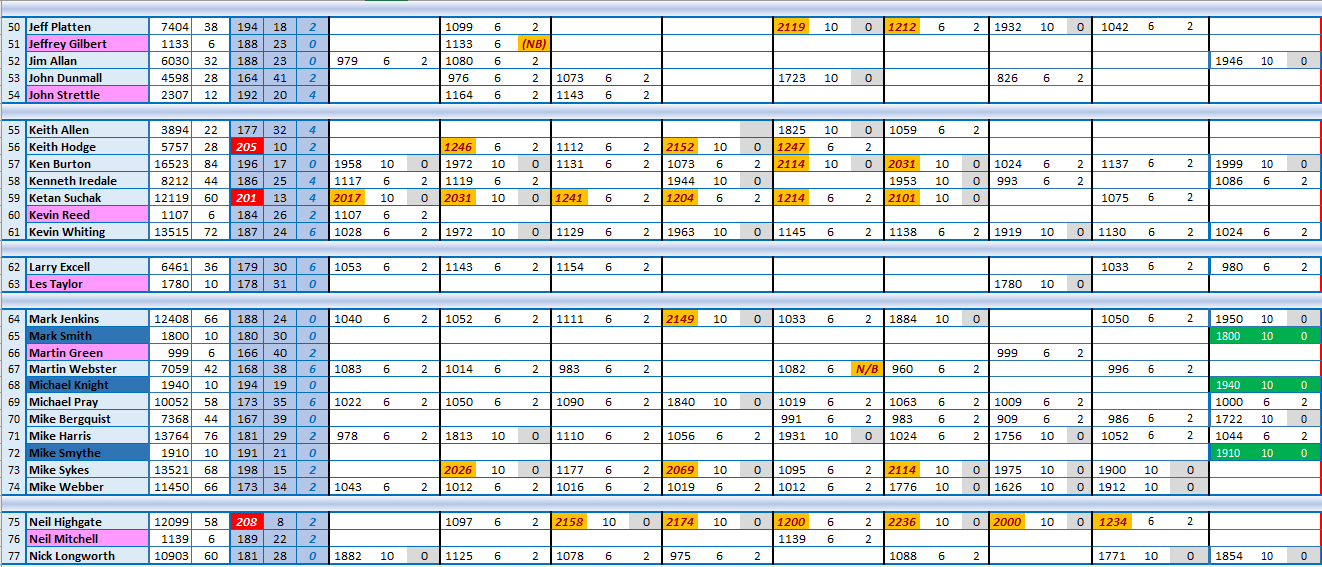
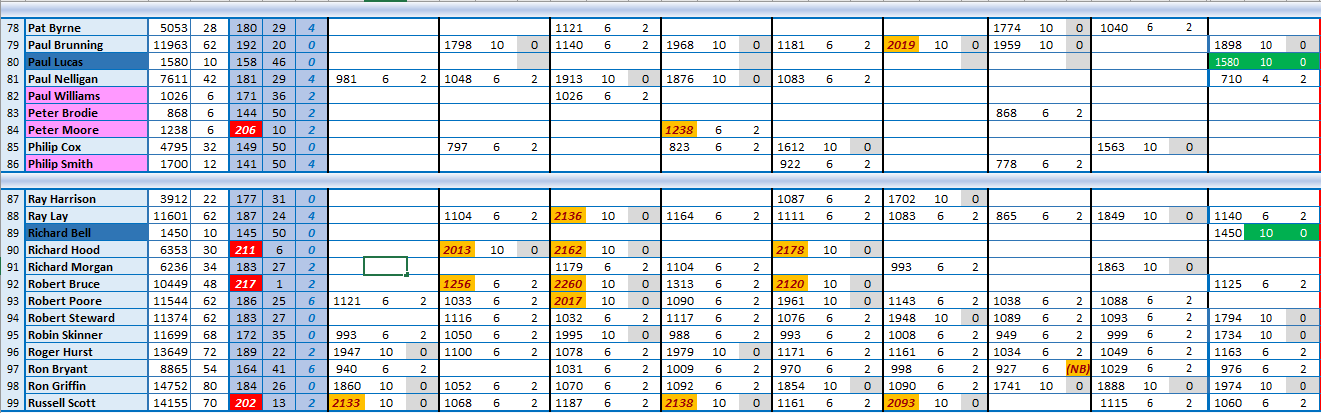
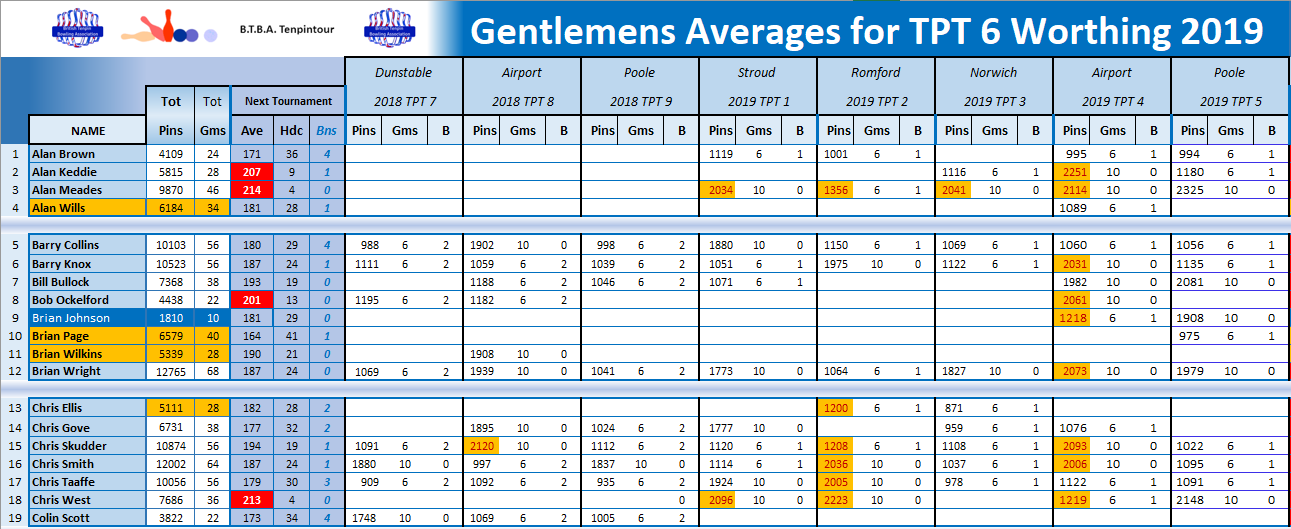
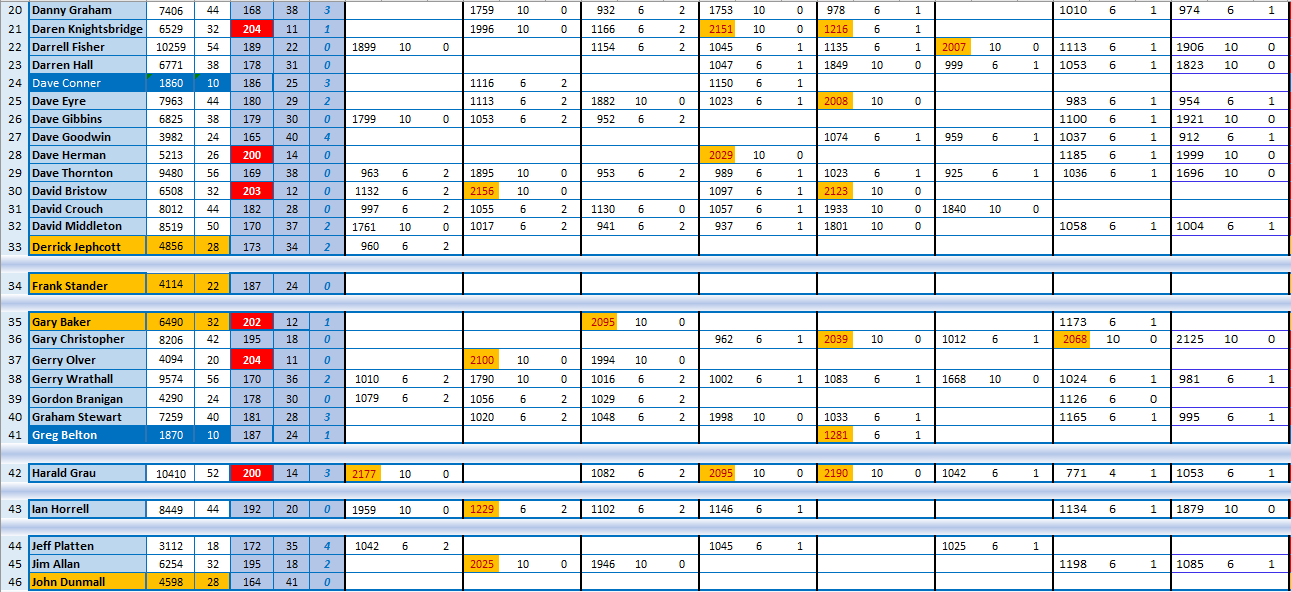
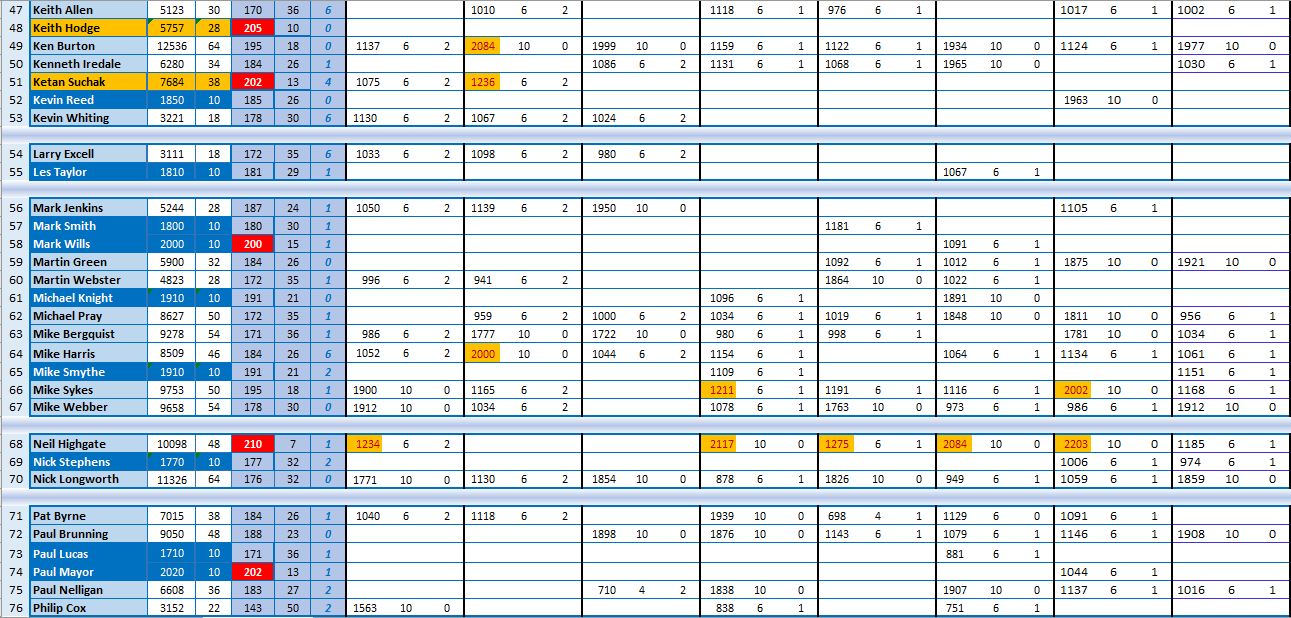
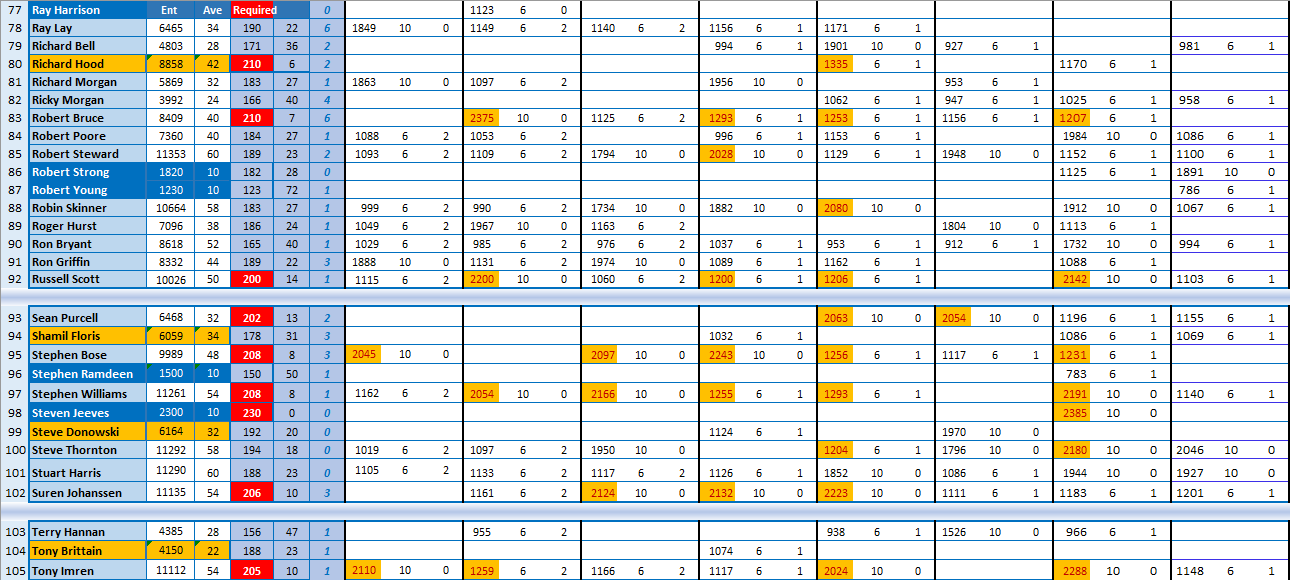
We go to great lengths to ensure that averages and handicaps are calculated correctly. So please check yours and if you spot a discrepancy report it ASAP to Chris Taaffe (via the contact page) who will get to the bottom of it straightaway.
For your information the calculation for handicaps is 75% of the difference between your average and the scratch score of 220.
For example : -
Average 180
220 - 180 = 40
Difference 40
75% of difference 30
Handicap 30
Averages and handicap are always rounded down to the previous whole number.
If for example your average is 184.97, your handicap will be calculated from that figure, which in this instance is 26.27
These figures will be rounded down to 184 and 26.
However the handicap calculator shows that the handicap from a 184 average is 27, which is also correct, because in the calculator handicaps are calculated from whole numbers.
Bonus Points
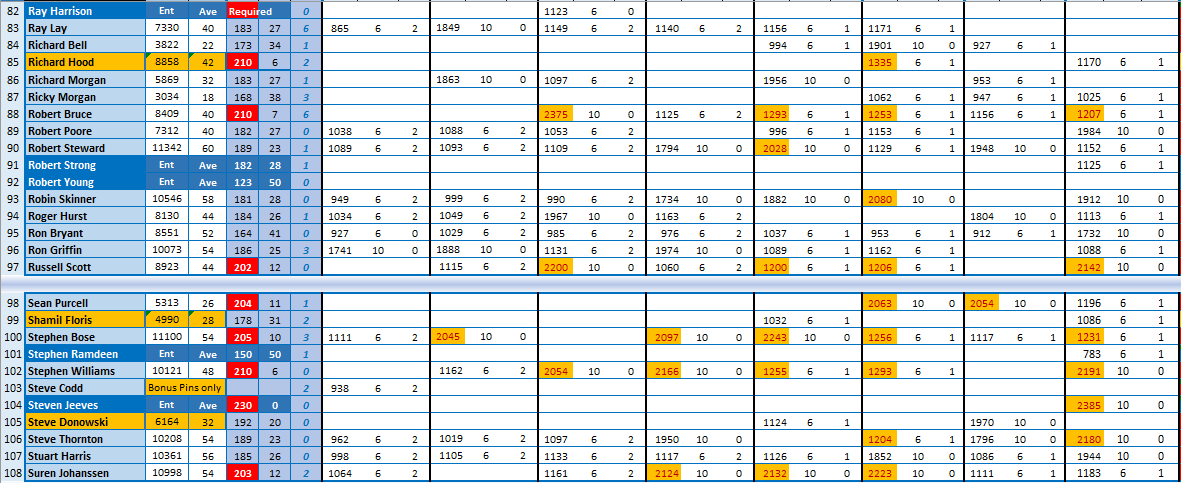
In addition to the handicaps, one Bonus points is allocated to bowlers who do not make the cut in any event, these points will accumulate on the rolling averages sheet, but will be capped at 6 bonus points. Bowlers who make the final will lose all of their accumulated bonus points. As your record rolls off the rolling averages sheet, any bonus points associated with that event will disappear.
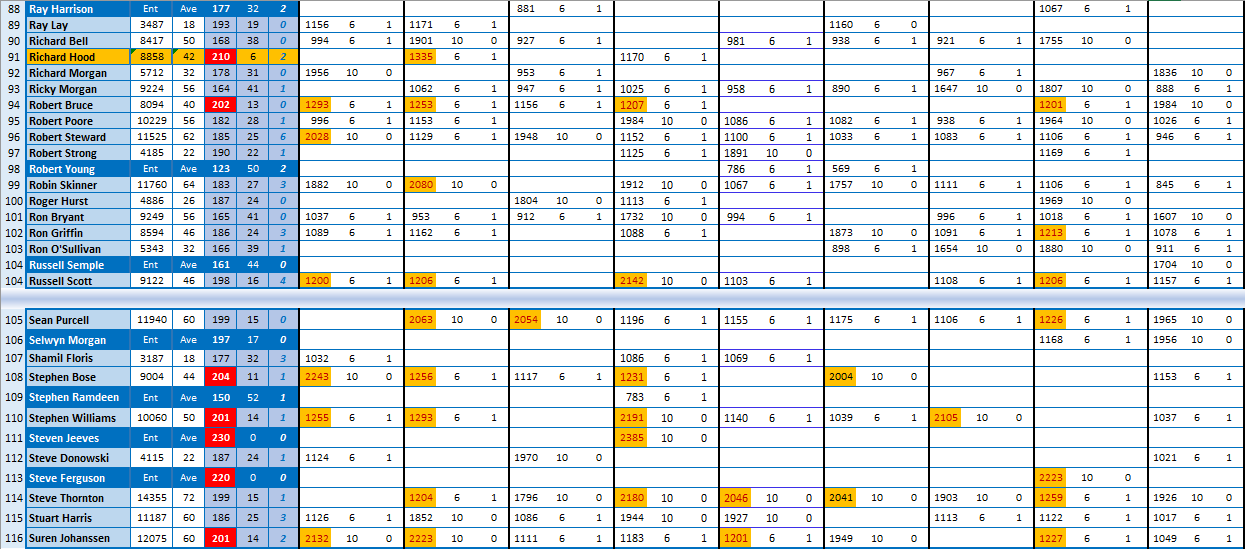
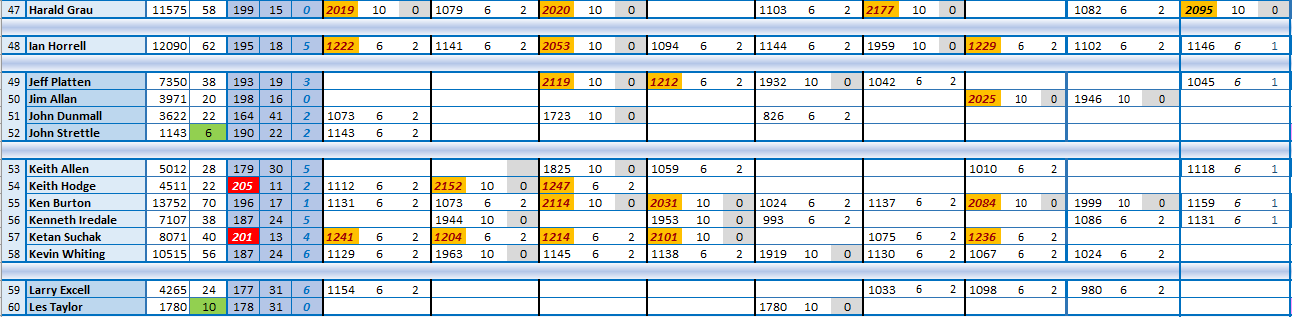
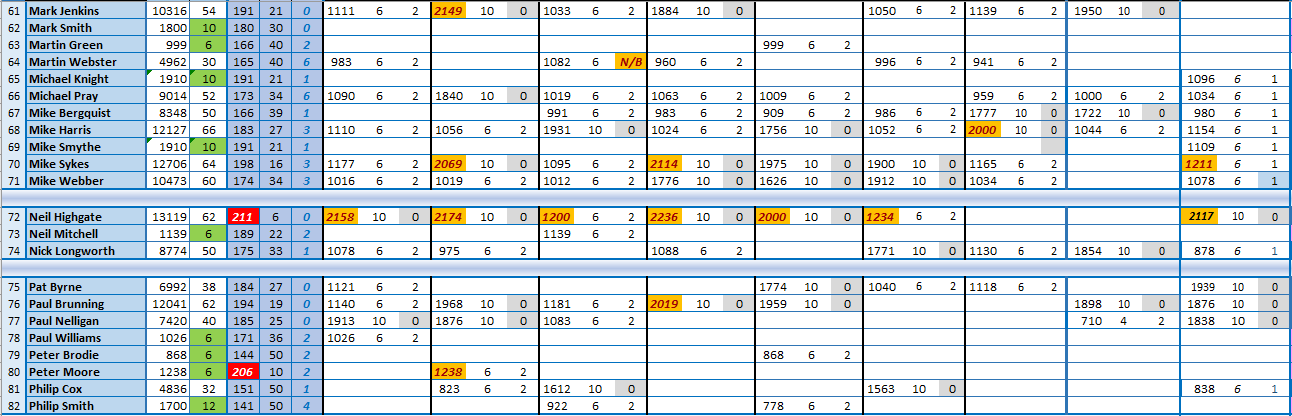
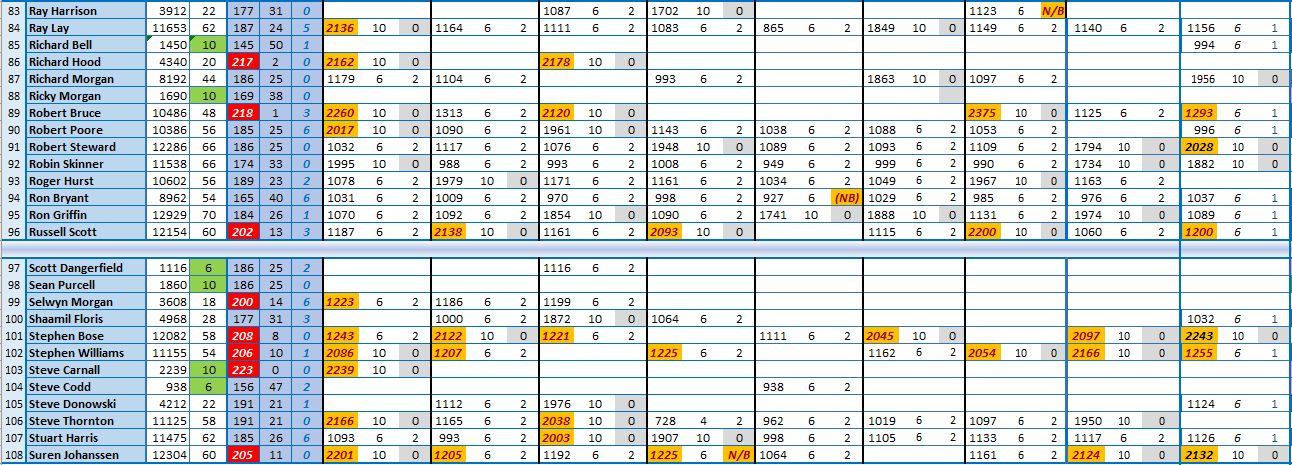
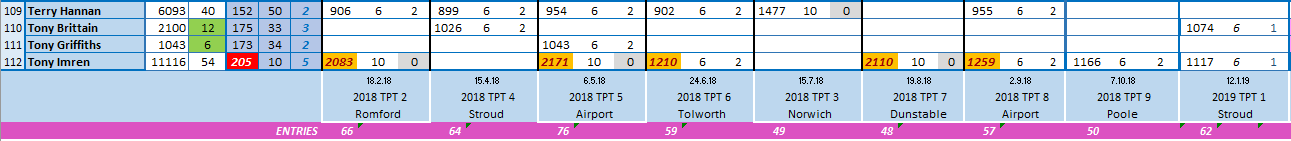
The rolling averages go back to all TPT Tournaments bowled within the past 12 Months.
Entering Averages
will be used to calculate handicaps until 18 games have ben bowled, and are subject to a rerate until then.
Self Check
You have a responsibility to ensure you are bowling off the correct average so please check that your average is correct and if there is a problem go to the contact page and report it. If you have any queries about your new averages and handicaps, and believe they may be incorrect don't hesitate to use contact box B and any mistakes or misunderstandings will be corrected or explained.
If a bowlers stats roll off the rolling averages sheet, they will have to declare an entering average for their next event to avoid the default scratch average of 220.
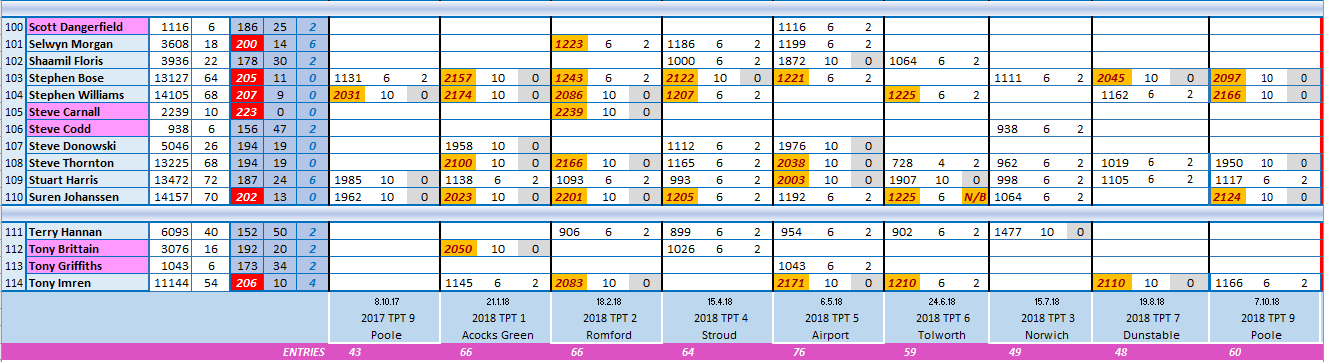
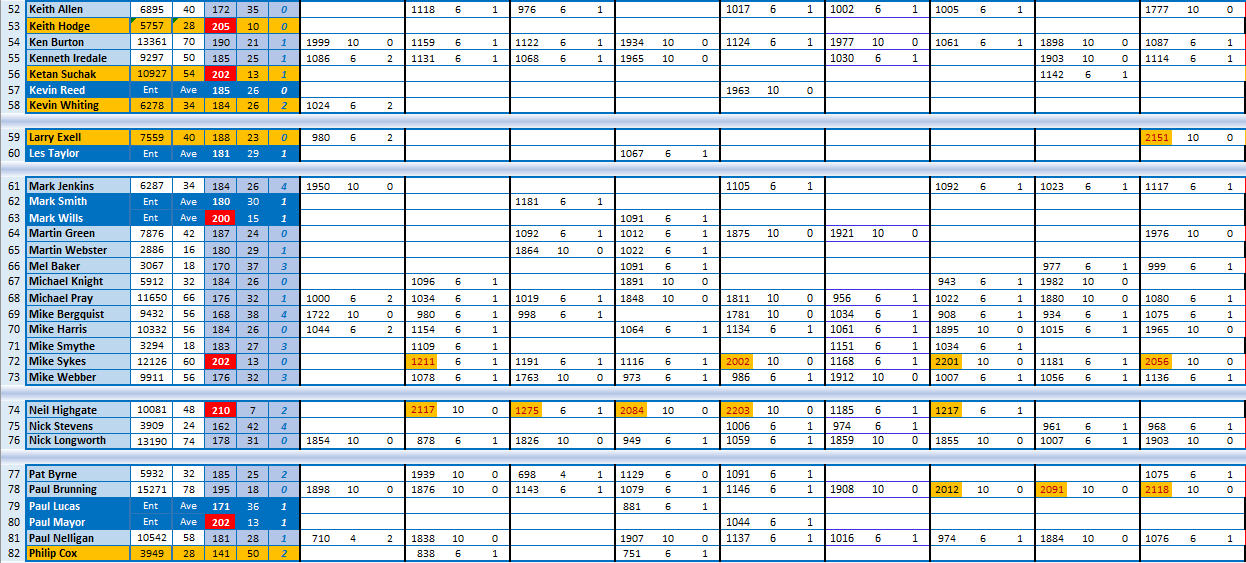
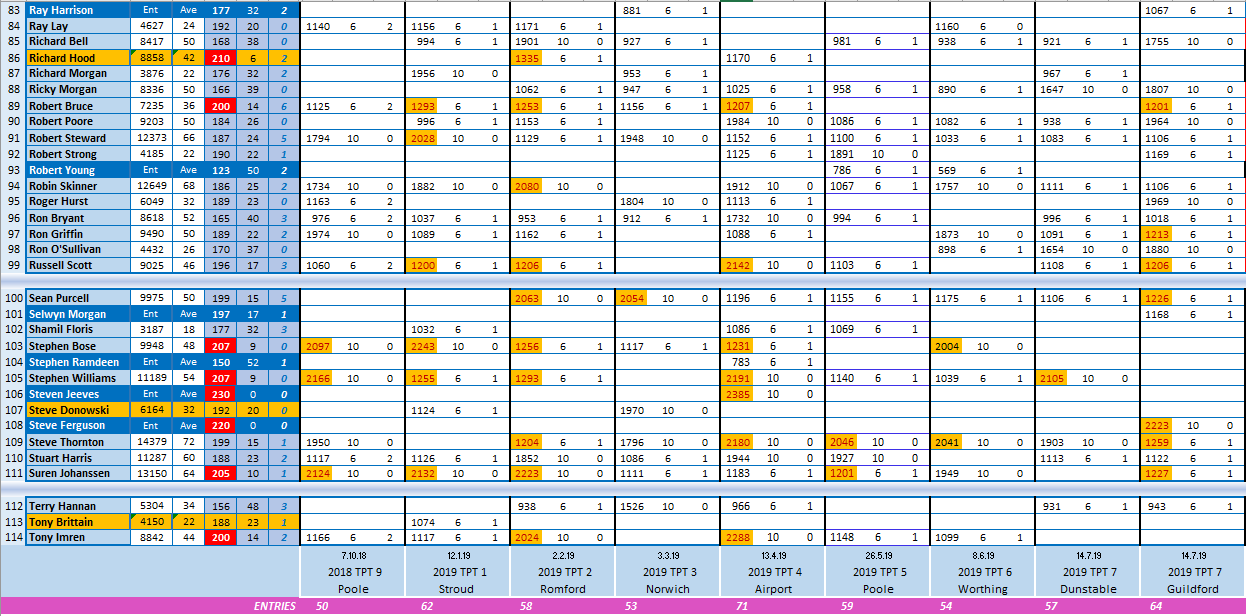
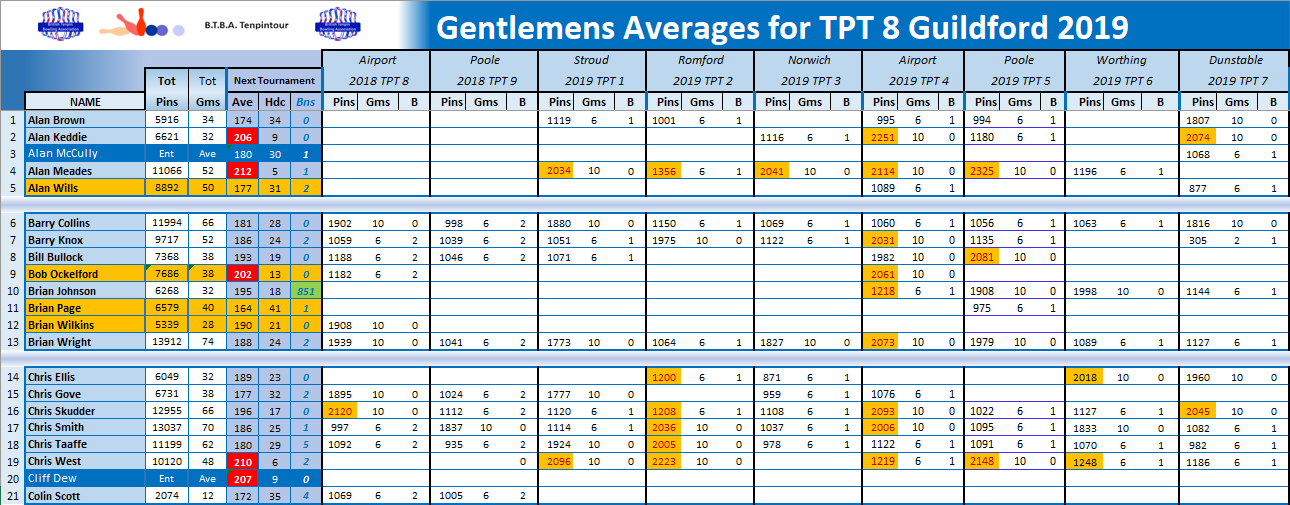
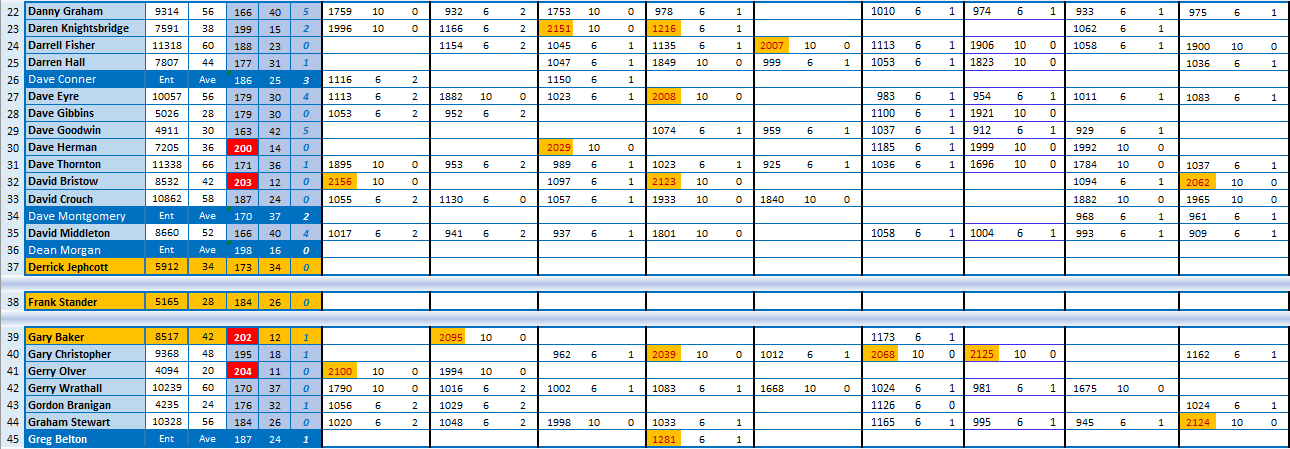
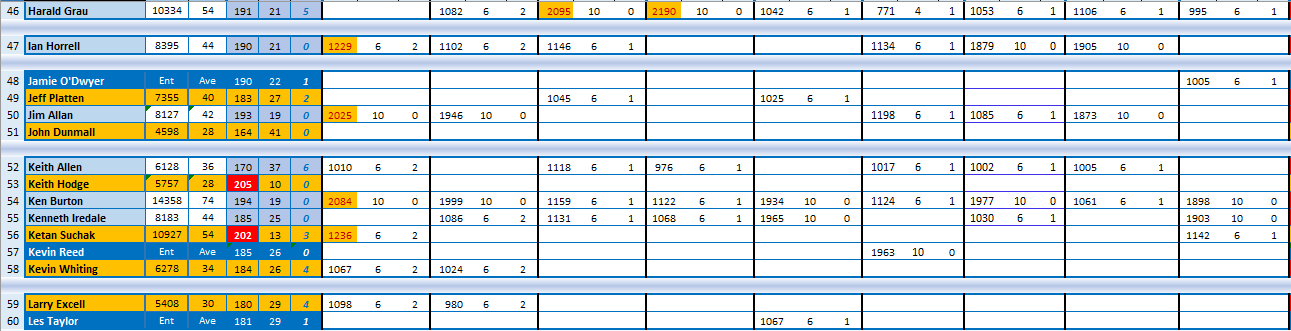
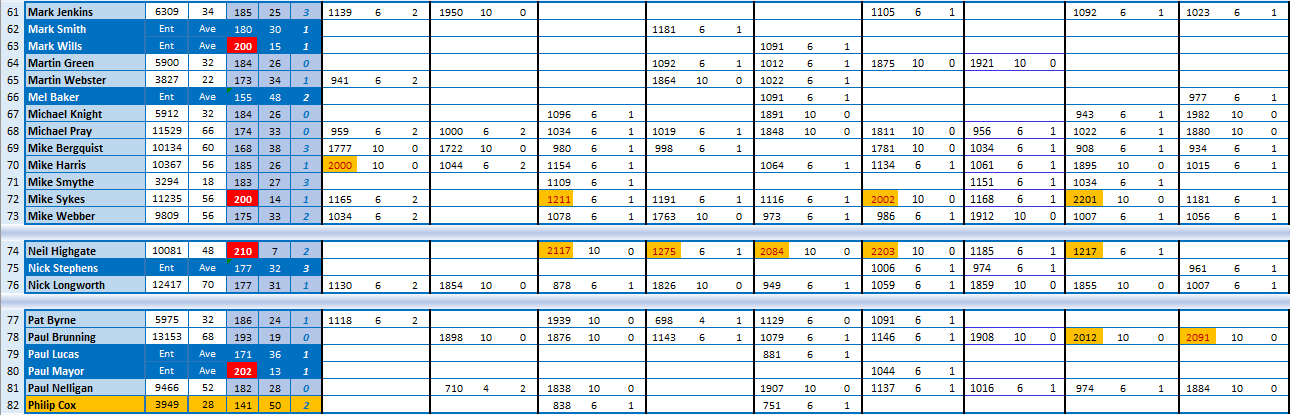
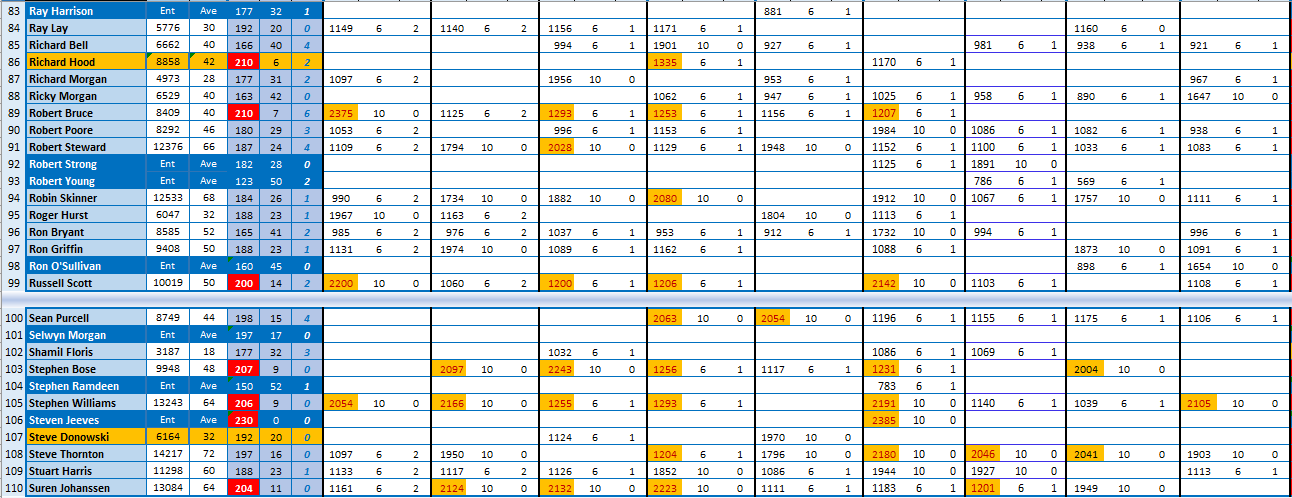
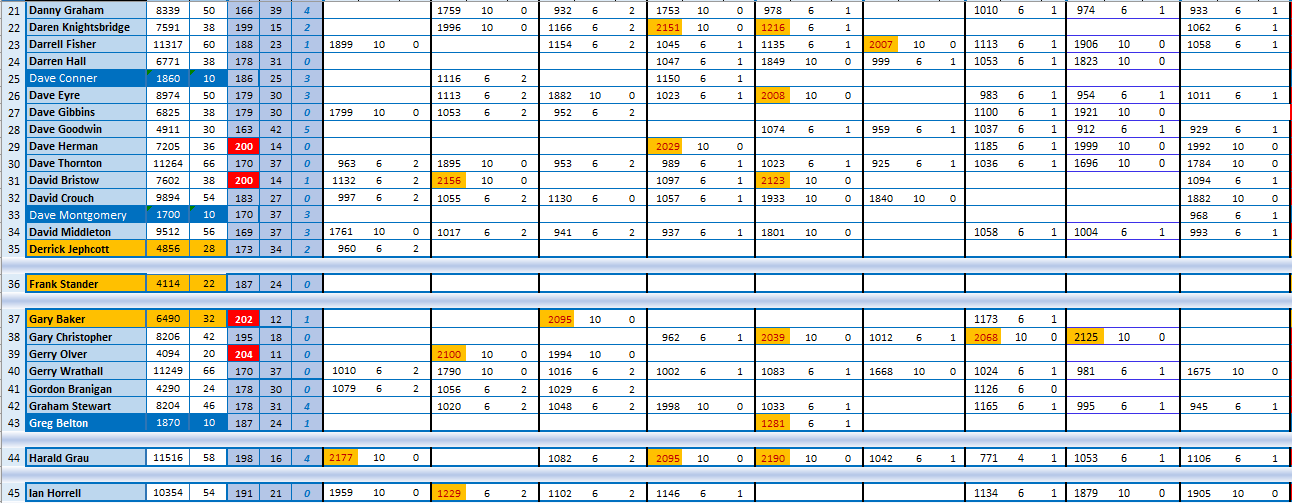
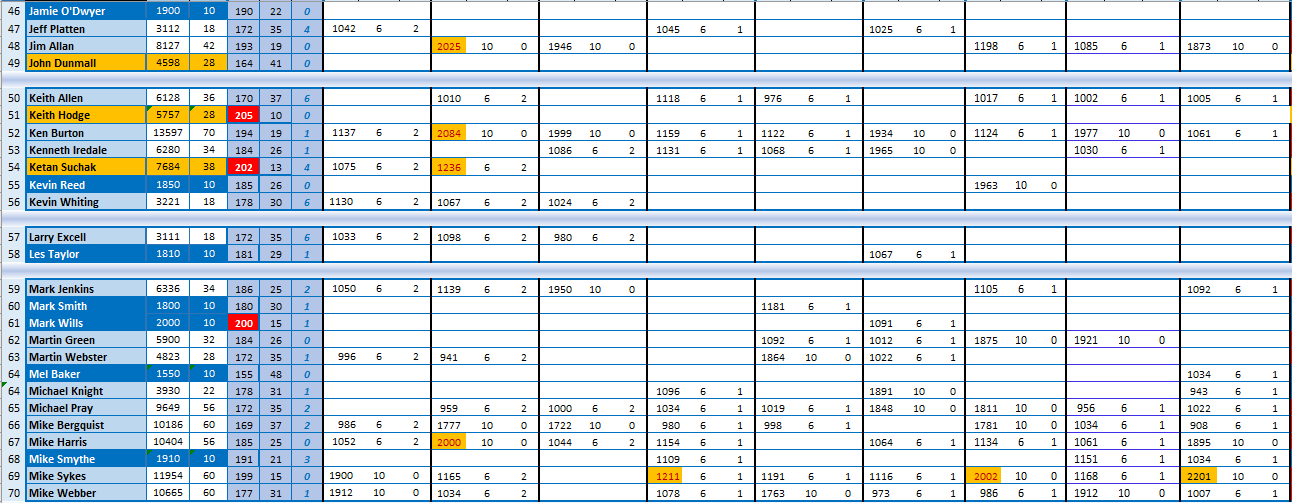
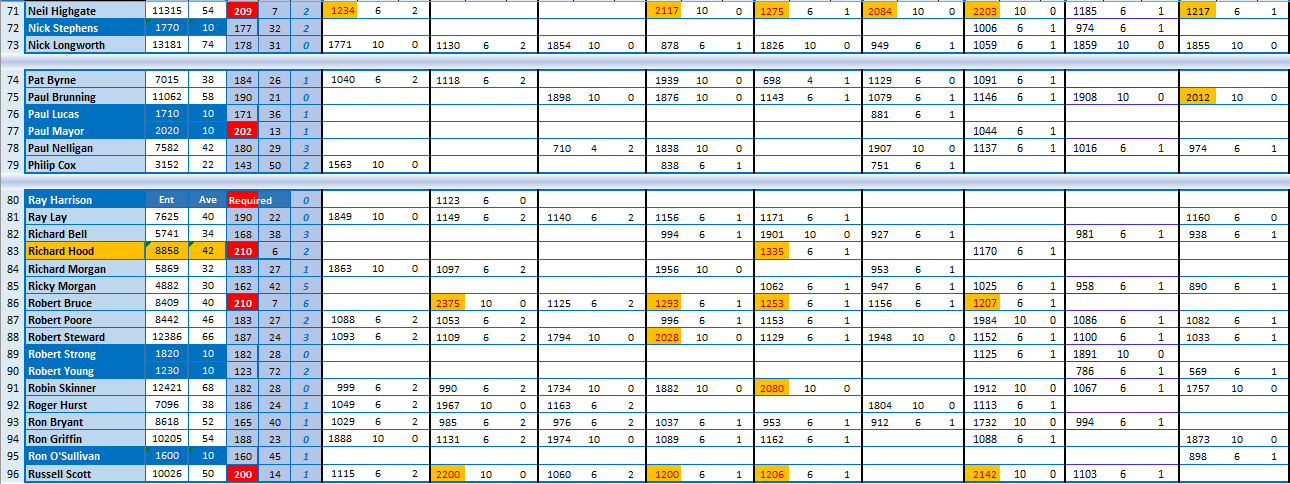
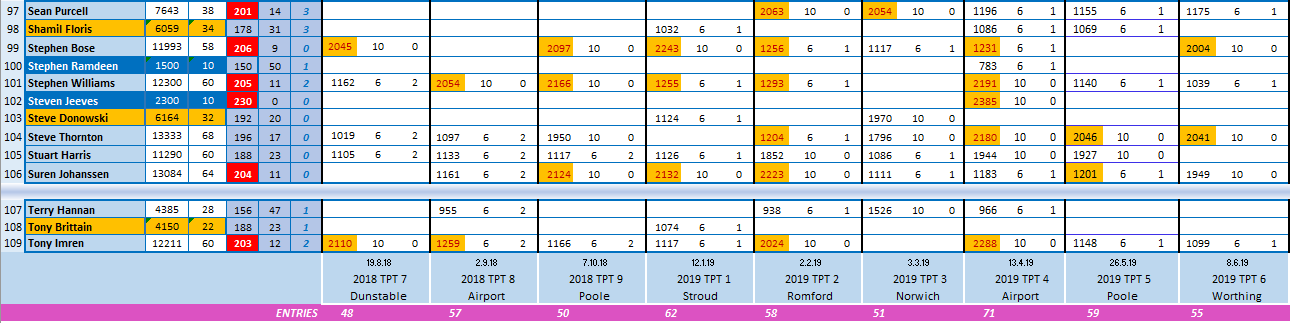
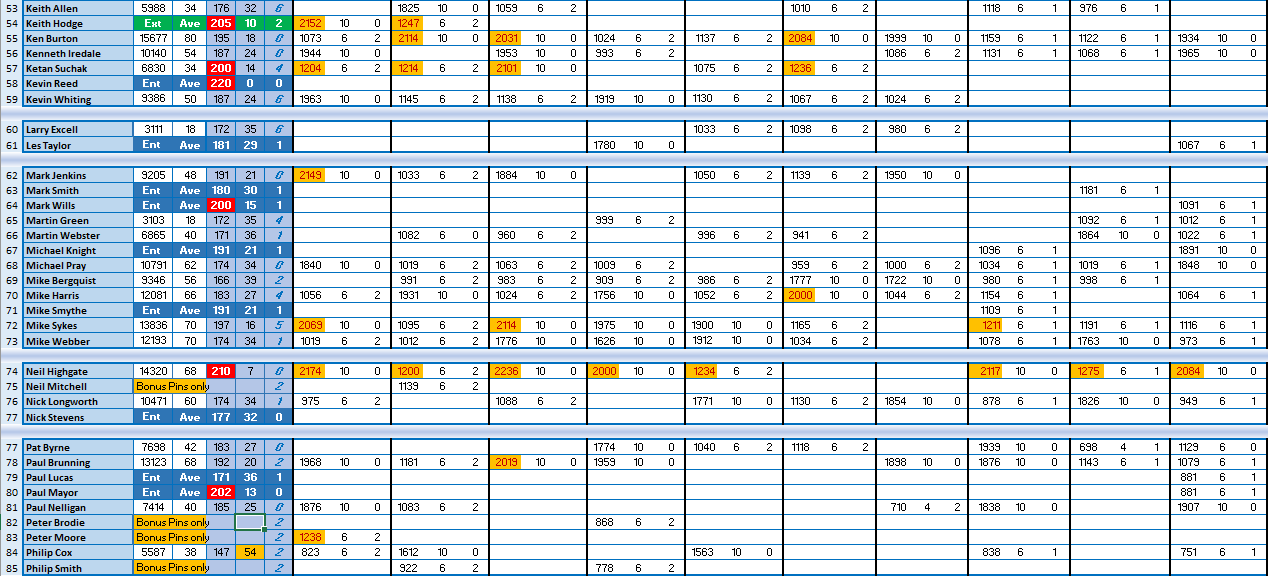
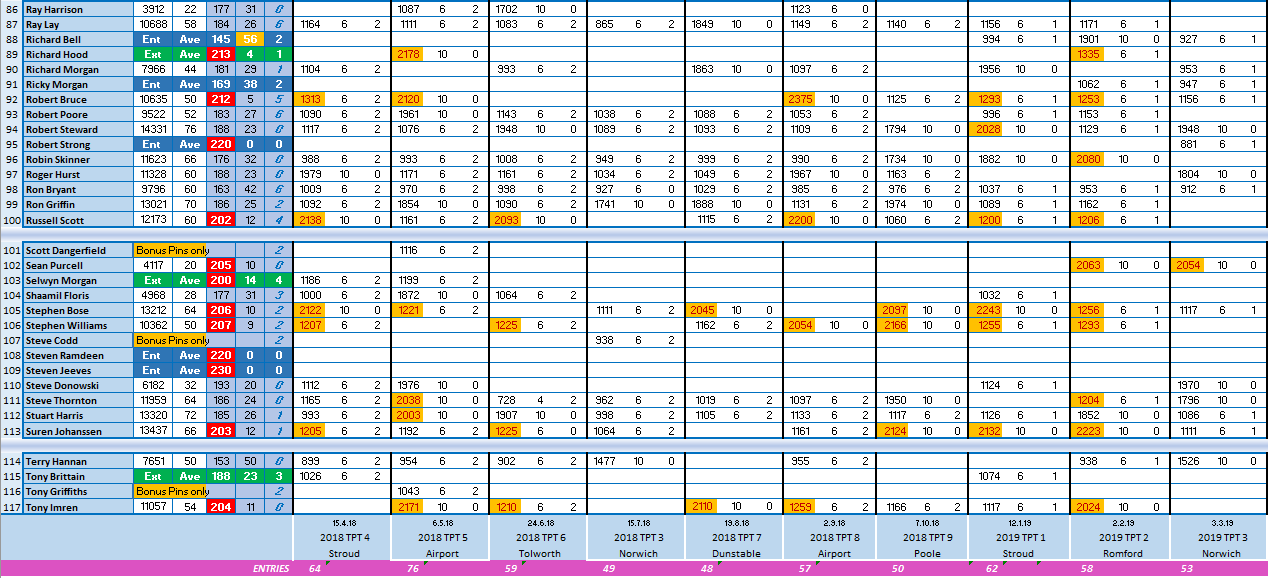
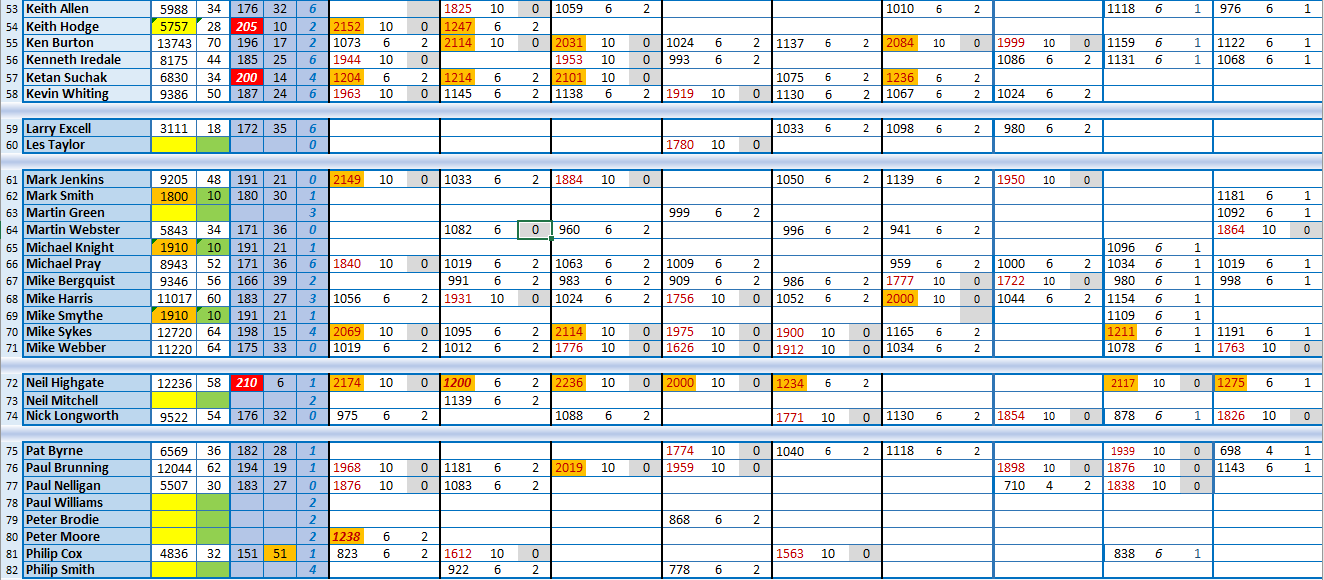
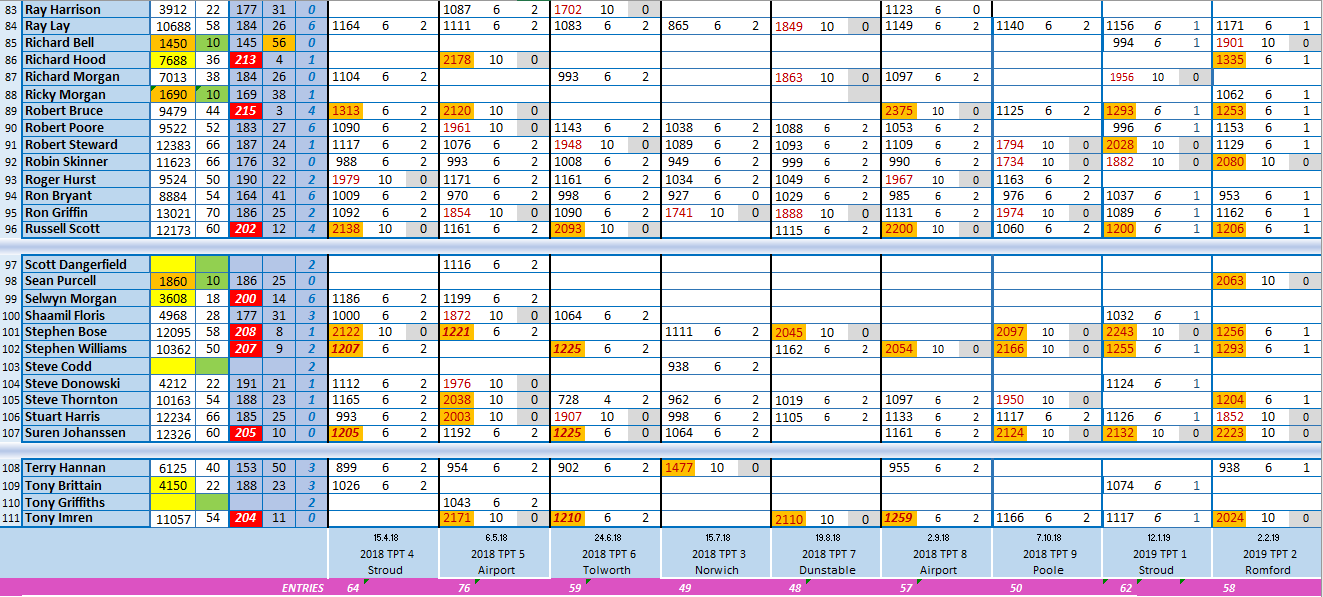
Please Note : - The rolling average sheet below includes TPT stats for all TPT events within the last 12 months. This particular 12 month period includes fewer events because of the postponement of TPT 3 Norwich last season. For this reason only eight events are shown below compared to the ten events on the previous sheet. The figures below may not be what you are expecting to see.
If your entering average is still current, your handicap will be based on that figure until you have bowled 18 games. These bowlers have Ent Ave against their names
If you are an existing TPT bowler who has less than 18 games on the current sheet, we have looked back to all TPT events from TPT 1 Acocks Green last season to give you an Extended TPT Average. These bowlers have Ext Ave against their names
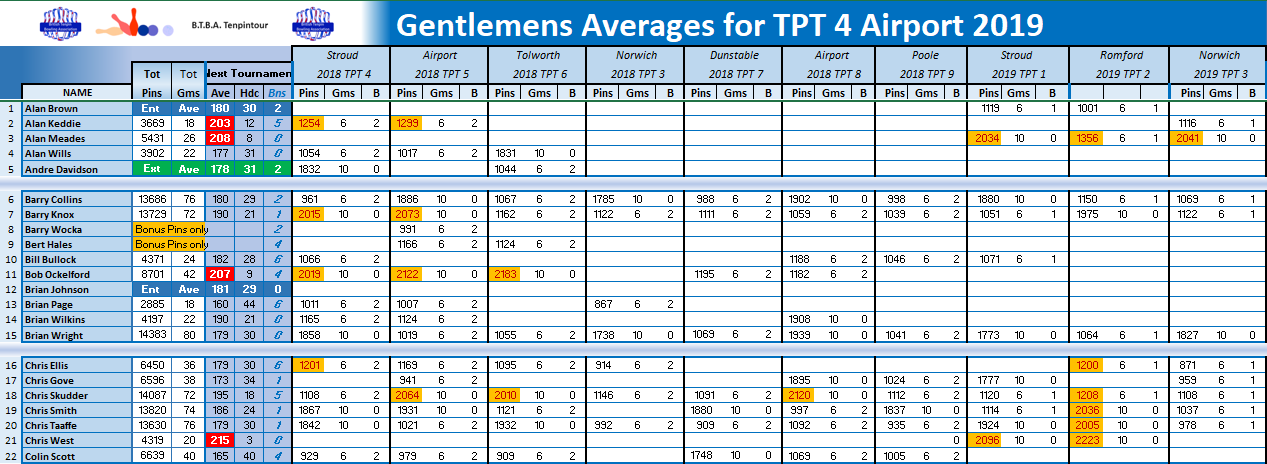
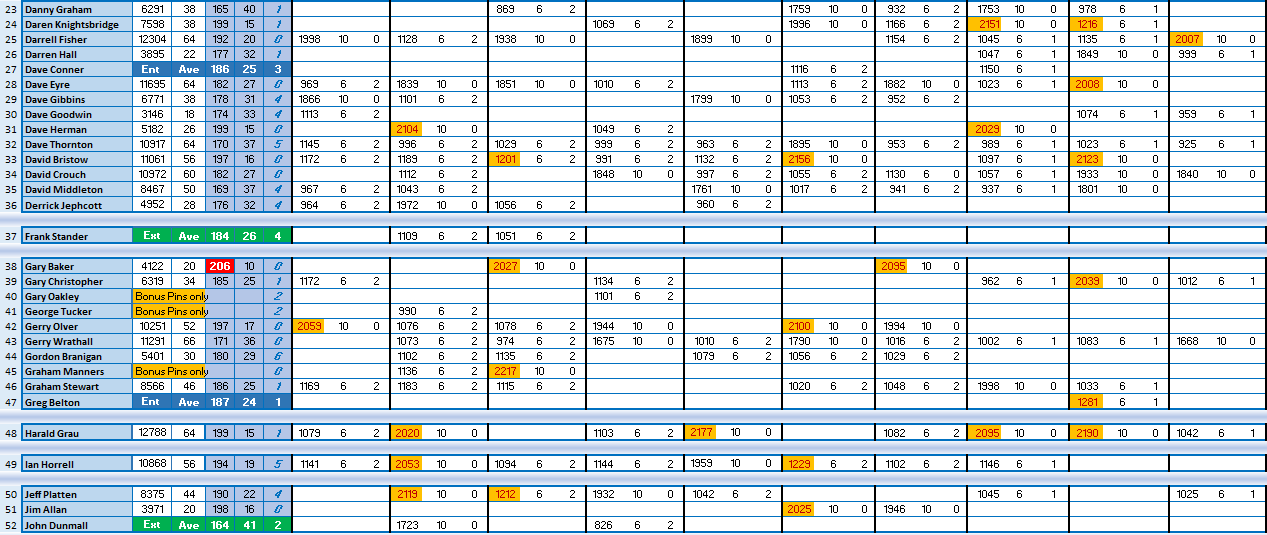
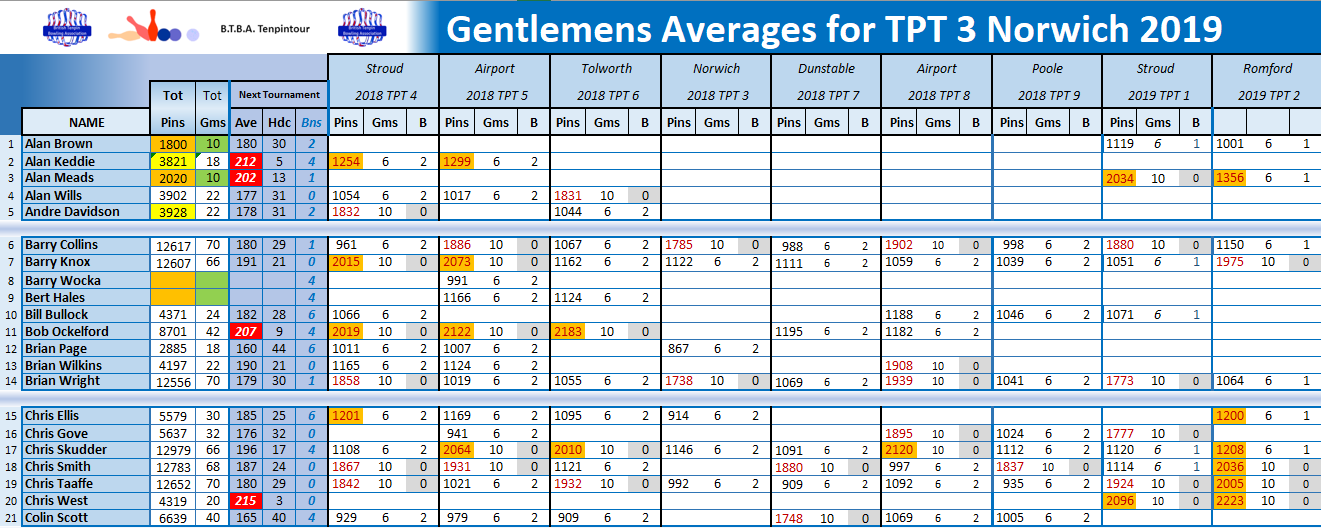
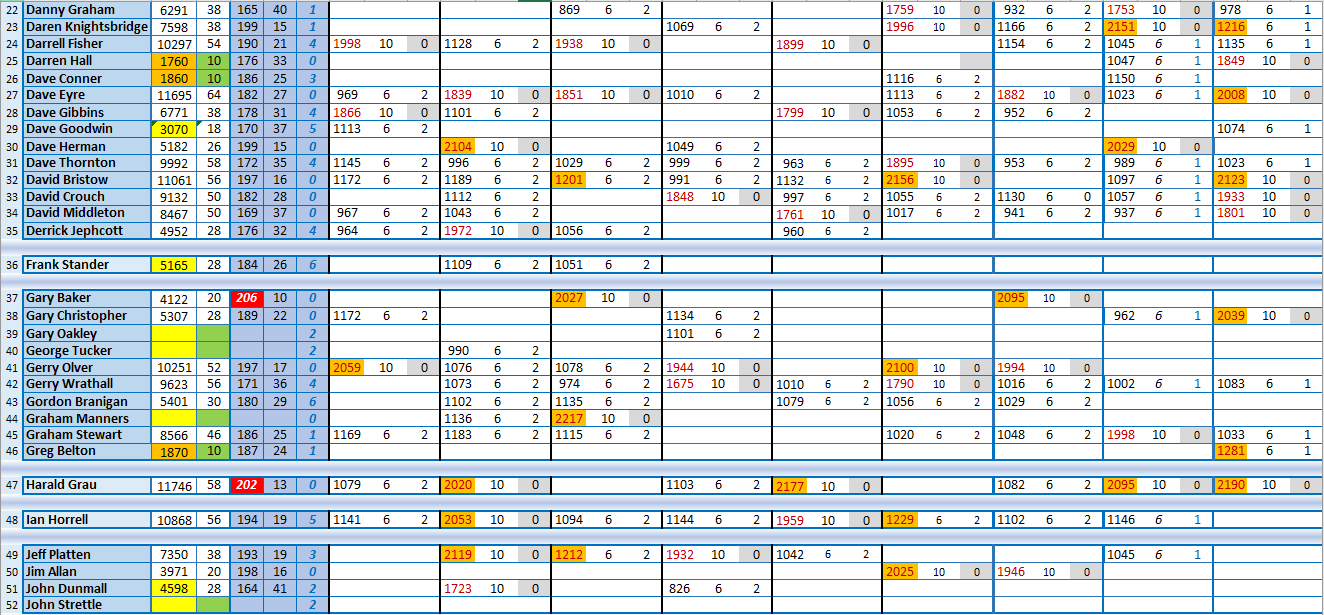
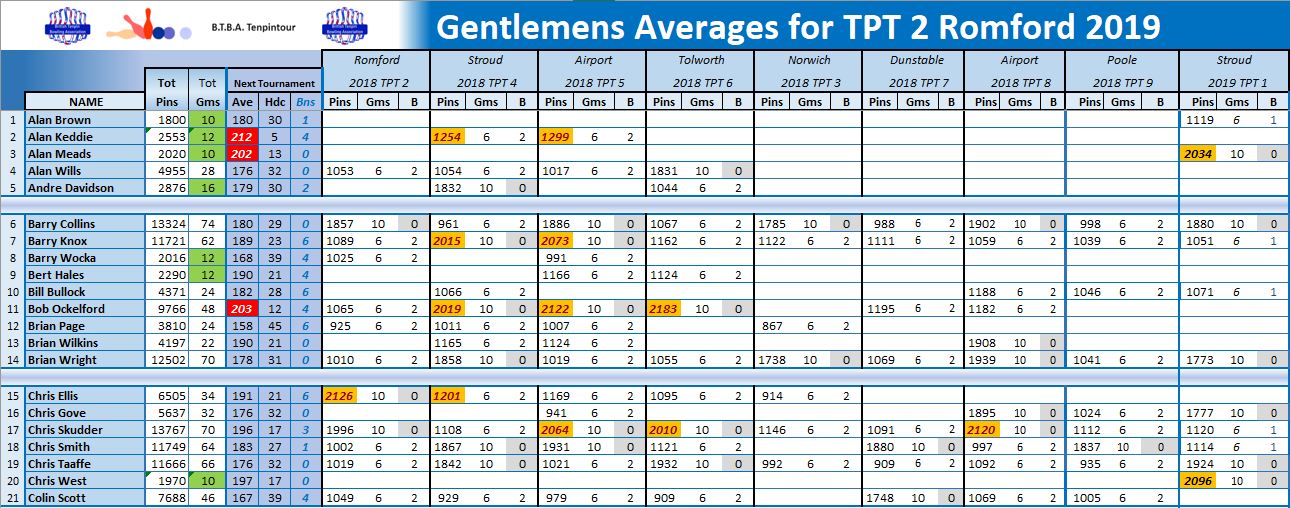
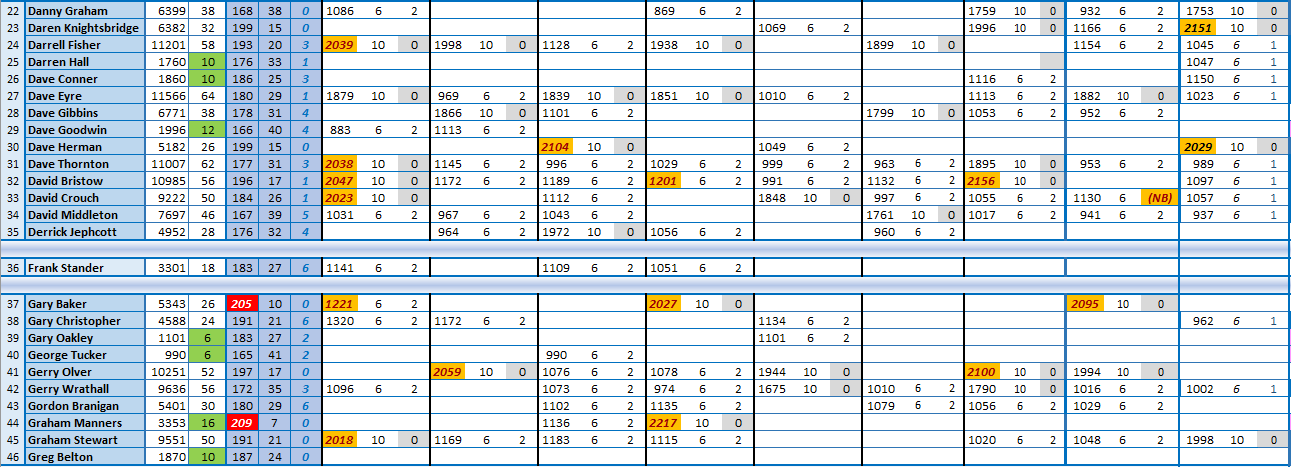
SEASONS FINAL AVERAGES AFTER TPT 9 NUNEATON
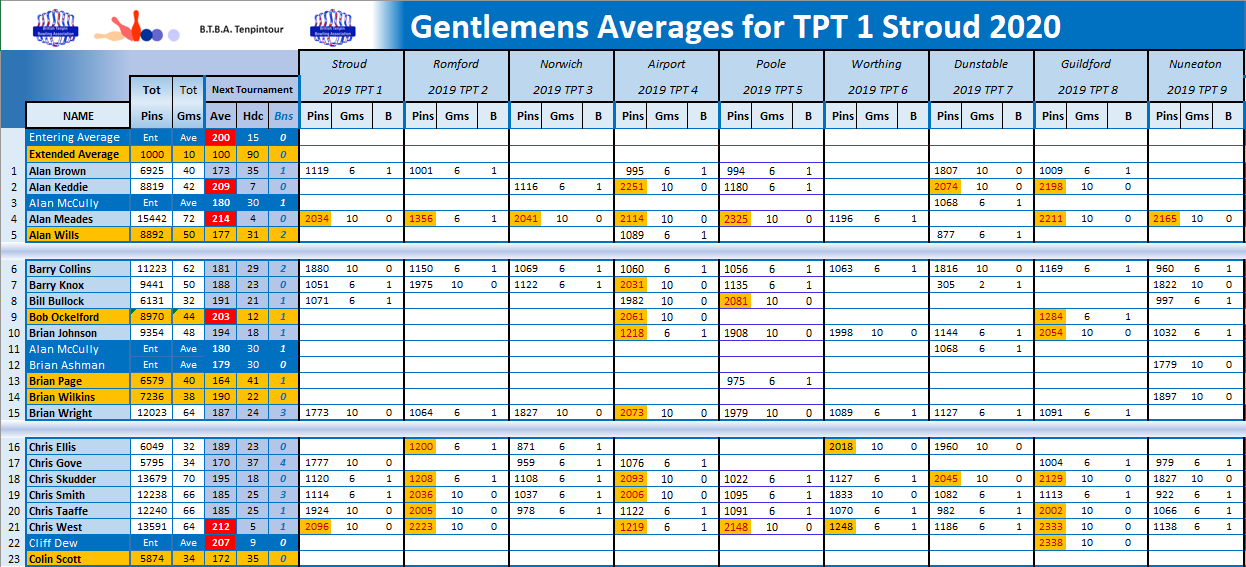
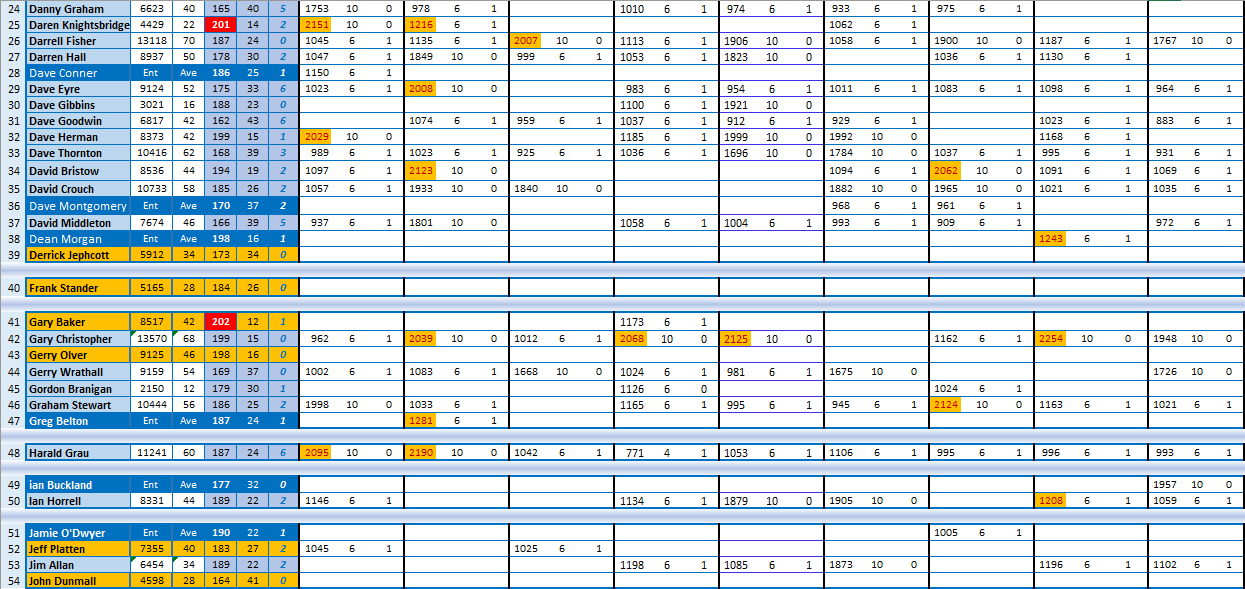
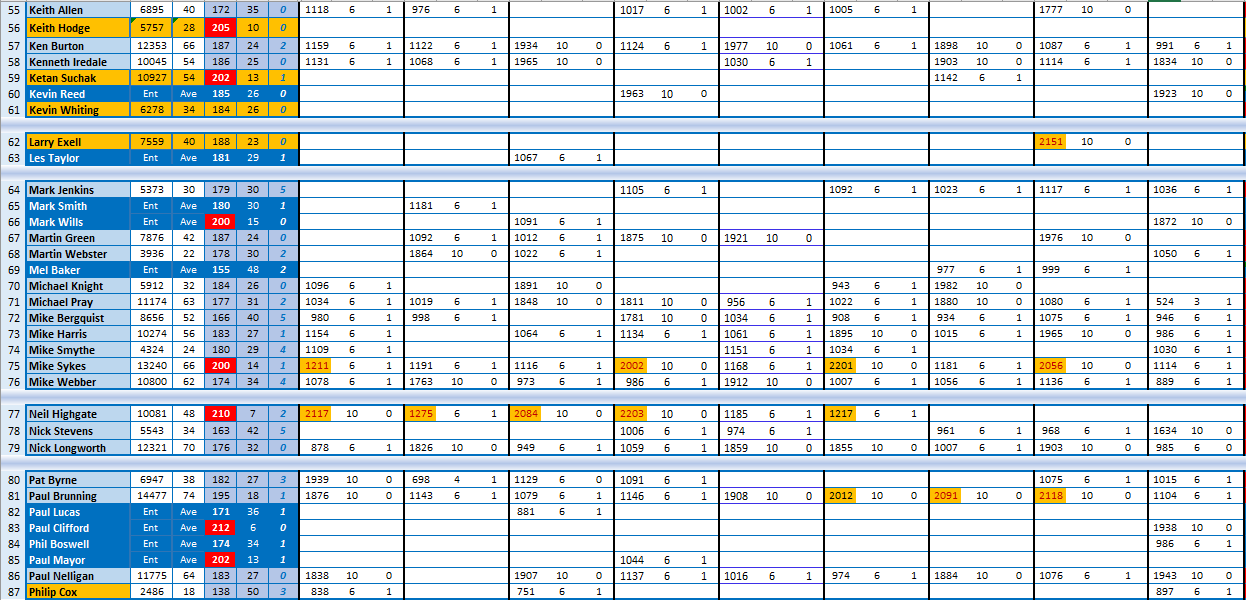
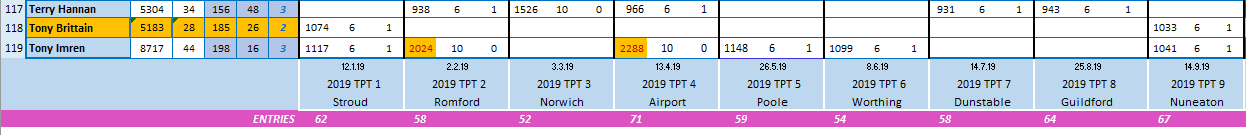
TPT 9 NUNEATON
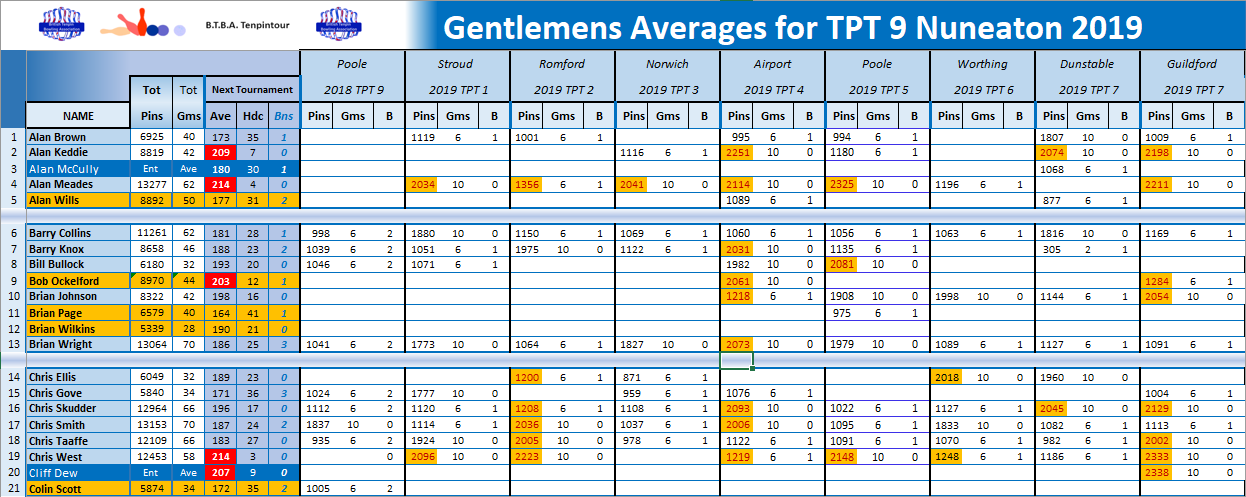
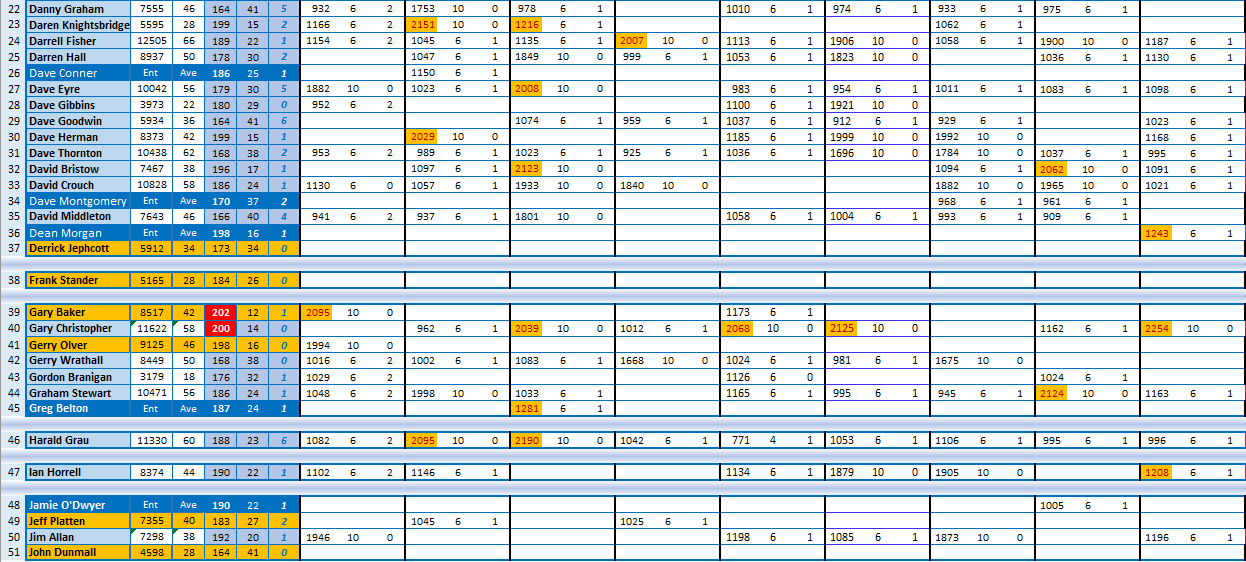
TPT 8 GUILDFORD

TPT 7 DUNSTABLE
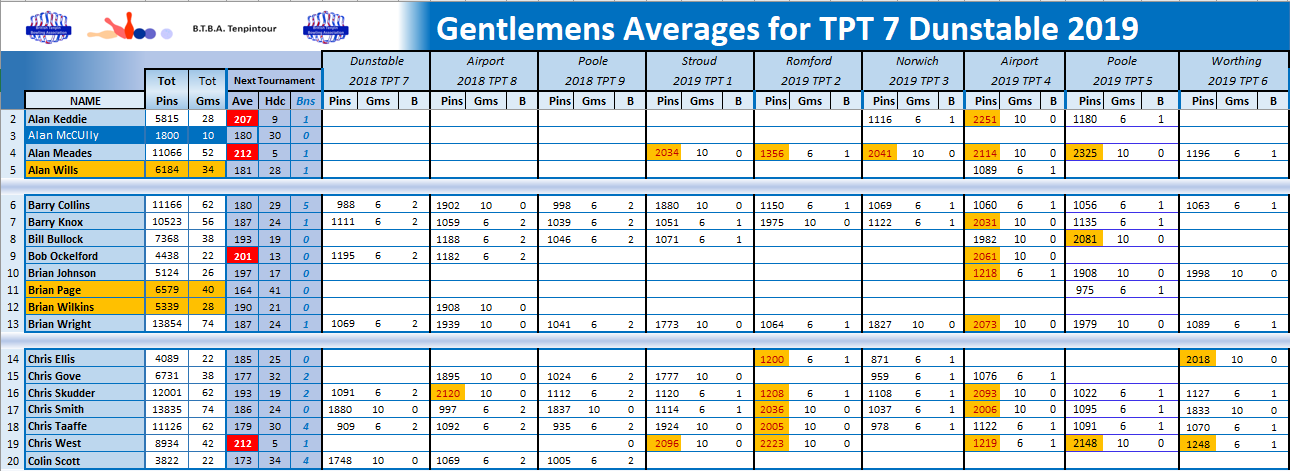
TPT 6 WORTHING

TPT 5 POOLE

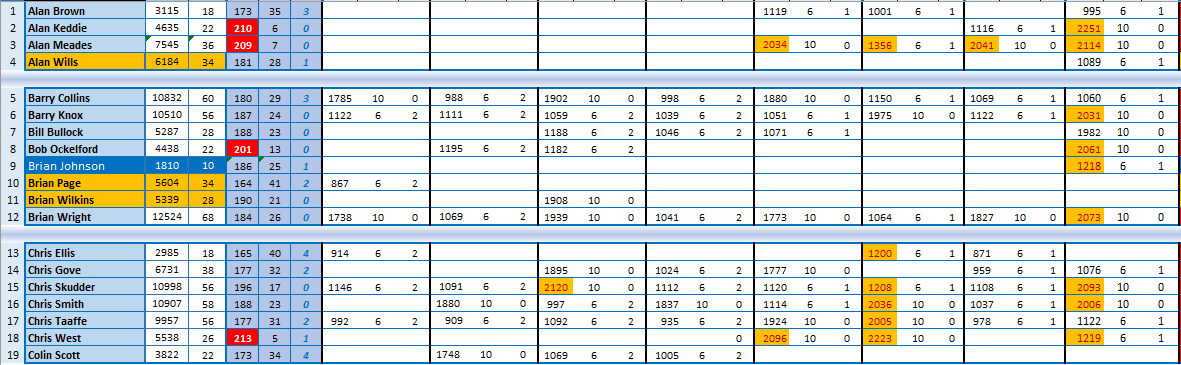
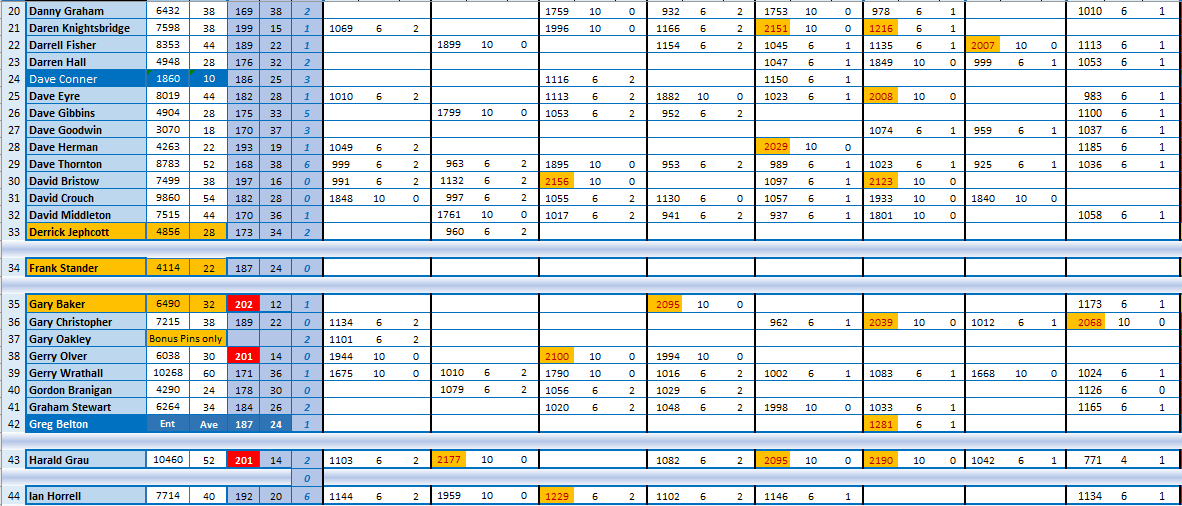
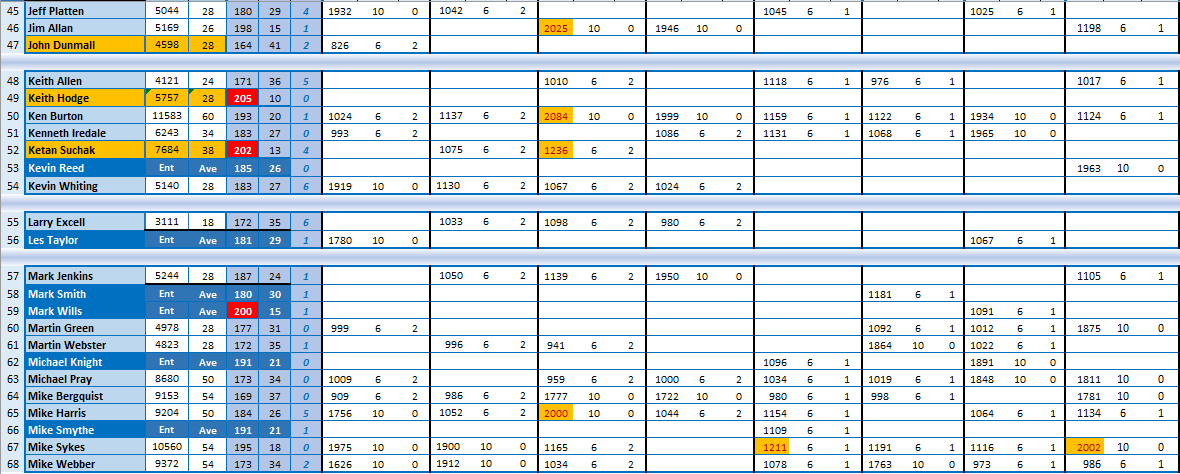
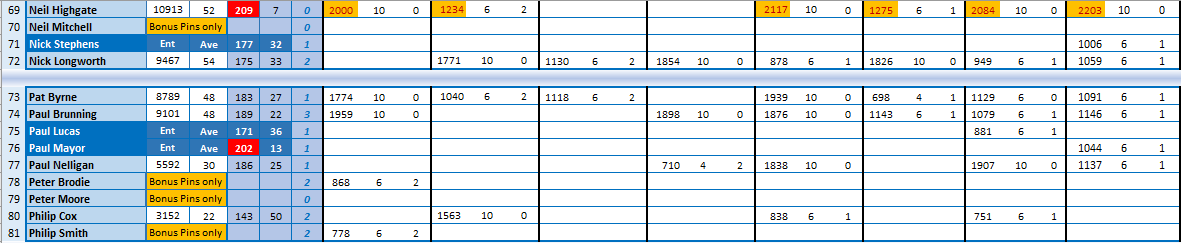
TPT 4 AIRPORT
TPT 3 NORWICH
TPT 2 ROMFORD

TPT 1 STROUD